
You deployed an AI classifier. It reports 92% average confidence. Everything looks great—until a client notices their finance emails keep landing in promotions. The confidence score never warned you.
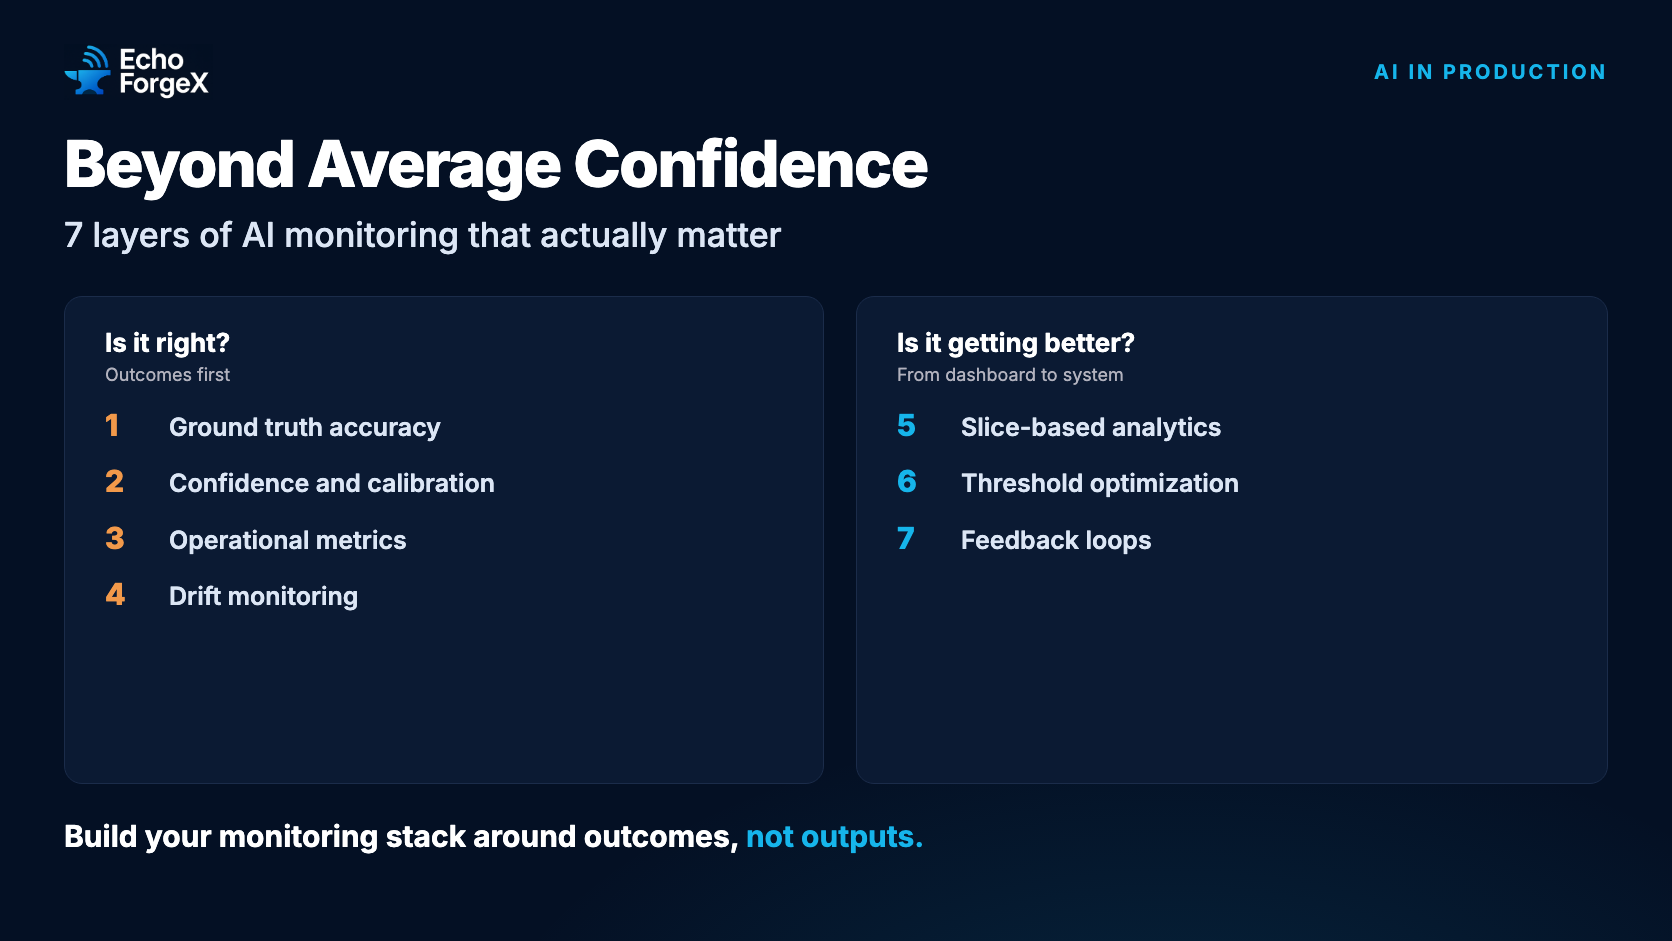
Average confidence alone is a weak signal. It’s useful, but it will mislead you if you don’t pair it with outcome-based metrics. Here are seven layers of monitoring that separate a production AI system from a demo.
1. Ground Truth Accuracy: Your Only North Star
Everything else is a proxy. If you can get labels—through human review, downstream outcomes, or delayed truth—track these first:
- Accuracy — overall correctness
- Precision / Recall / F1 — especially critical for imbalanced classes
- Confusion matrix — which classes get confused with which
- False positive / false negative rates per class — where the real damage lives
“Finance emails misclassified as promotions” is infinitely more actionable than “overall accuracy = 92%.”
If labeling everything is too expensive—and it usually is—sample 1–5% of predictions for human review. Oversample low-confidence and edge cases. That targeted sampling gives you dramatically better signal than reviewing random predictions.
2. Confidence and Calibration: Do It Right or Don’t Bother
Yes, track confidence—but track it correctly. Averages are dangerous. If your model always outputs 0.95 confidence, your average looks stellar even when it’s wrong.
What you actually want:
Calibration curves. When the model says 80% confidence, is it right roughly 80% of the time? If not, your confidence scores are decorative.
Bucket analysis. Break predictions into confidence bands and measure actual accuracy in each:
| Confidence Band | Actual Accuracy | Signal |
|---|---|---|
| 90–100% | 97% | Trust automation here |
| 70–80% | 65% | Needs review |
| 50–60% | 40% | Don’t automate this |
This tells you exactly where to draw the line between automation and human review—which brings us to threshold optimization later.
3. Operational Metrics: What Happens After the Prediction
This is where deployed AI systems actually succeed or fail, and it’s the layer most teams ignore.
Track what happens after the model makes a decision:
- % of classifications overridden by humans — if high-confidence predictions are frequently corrected, your model is overconfident (dangerous)
- Time saved vs. manual baseline — the whole point of automation
- Downstream error impact — missed leads, wrong routing, escalation delays
- Conversion rates by classification bucket — does the classification actually matter to outcomes?
- User complaints and corrections — the ground truth you didn’t ask for
A model can be 95% accurate and still destroy value if the 5% it gets wrong are high-stakes decisions. Operational metrics catch what accuracy alone cannot.
4. Drift Monitoring: Your Model Will Degrade
This isn’t a maybe. Every model degrades in production. The world changes; your training data doesn’t.
Input drift: Are the inputs changing? New types of emails, different customer segments, seasonal patterns your model has never seen.
Output drift: Is the distribution of predictions shifting? If “promotions” jumps from 20% to 45% of classifications, that’s not growth—that’s a data shift your model is mishandling.
Performance drift: Compare accuracy on recent labeled samples against your historical baseline. A slow decline is harder to catch than a sudden break, but it’s just as damaging.
Set up automated alerts when distributions shift beyond thresholds. By the time someone notices manually, you’ve already served weeks of degraded predictions.
5. Slice-Based Analytics: Where Real Insights Live
Global metrics hide problems. A model that’s 95% accurate overall might be 72% accurate on long-form inputs, or 60% accurate for a specific customer segment.
Break performance down by dimensions that matter to your business:
- Customer segment or account tier
- Input length and type
- Channel (email vs. form vs. API)
- Geography and language
- Time of day and seasonality
The aggregate number is for dashboards. The slices are where you actually improve. Every “good enough” global metric is hiding a segment that’s underserved.
6. Threshold Optimization: Turning AI into a System
Instead of blindly trusting every prediction, define confidence thresholds that route decisions appropriately:
- High confidence (>0.9): auto-process without human intervention
- Medium confidence (0.6–0.9): queue for soft review or take tentative action
- Low confidence (<0.6): route to human review
Then track accuracy, volume, and cost within each band. The goal isn’t maximum automation—it’s the right tradeoff between speed and correctness for your specific use case.
At EchoForgeX, our agent platform uses exactly this pattern: high-confidence classifications are processed automatically, while edge cases route to a review queue. The queue isn’t a bottleneck—it’s an exception handler that catches what the AI shouldn’t decide alone.
7. Feedback Loops: How the System Gets Better
Without structured feedback, your model is frozen at deployment. You need to capture corrections and feed them back into improvement cycles.
For every prediction, log:
input_id
input_text (or reference)
predicted_class
confidence_score
timestamp
model_version
true_label (when available)
corrected_label (when overridden)
human_review_flag
Every human correction is a free training signal. Feed corrections back into prompt refinement (for LLM-based systems) or retraining (for traditional ML). The system should get measurably better each month—and if it’s not, your feedback loop is broken.
The Mindset Shift
Most teams monitor AI like this: “What confidence is the model giving?”
Production-grade teams think like this: “When the model says X with Y confidence, what actually happens in the real world?”
That’s the difference between a demo and a system. Build your monitoring stack around outcomes, not outputs, and you’ll catch problems before your users do.
Building Your Dashboard
At minimum, you need visibility into:
- Accuracy over time (trending, not snapshots)
- Confidence vs. actual accuracy (calibration)
- Confusion matrix (updated weekly)
- Input and output drift indicators
- Human override rate
- Performance by slice
Most of this can be built with a Postgres table, a few scheduled queries, and your existing dashboarding tool. The hard part isn’t infrastructure—it’s discipline. You have to actually look at the dashboards and act on what they show.
At EchoForgeX, we build AI-powered tools and help businesses integrate AI into their workflows. Get in touch to learn how we can help your team work smarter with AI.